Category: Brain Science

  • The Origins of Our Cortical Circuits

    Brains make sense and perceptions from the signals that flow through them. Can we identify elementary neural “wiring” configurations and interactions that help us to understand how brains accomplish this feat?

    Figure 1. A 40 nanometers wide slice of mouse neocortex cut from a one cubic millimeter sample. The sample this slice was taken from was about the size of a grain of sand and contained about one hundred thousand neurons with nearly a billion synapses. From the “ Allen Institute for Brain Science” and “The Quest to Unravel The Connectome“.
    Figure 2. A schematic diagram of currently established elementary circuit configurations. The red triangle represents the cell body of a pyramidal cell. The thick trunk reaching up and ending with two thinner branches reaching diagonally is the pyramidal cell’s apical dendrite. The branches reaching diagonally down from the triangle’s two lower corners represent its basal dendrites. An axon leaves the bottom center of the pyramidal cell to various destinations (see text). Two other axons (red) enter the diagram. The axon that enters from right comes from other cortical areas. The axon that enters at left from below carries sensory input from the visual thalamus. Two inhibitory interneurons (blue) complete the circuit. ffexc: feed forward excitation, fbexc: feed back excitation, lexc: lateral excitation, ffinh: feed forward inhibition, fbinh: feedback inhibition. Figure 2(A) from “Neocortical Lamination: Insights from Neuron Types and Evolutionary Precursors” published November 7, 2017 in Frontiers in Neuroanatomy.
    Cortical tissue is packed tight with neurons, dendrites, and axons as illustrated in the electron microscope image of a slice of mouse neocortex in Figure 1 above. To better comprehend this tangle, neuroscientists have worked to identify elementary categories of interactions between neurons and the ways those neurons are wired together.

    Neurons in cortical tissue can be divided into excitatory and inhibitory cells as in Figure 2 at right (red for excitatory and blue for inhibitory). This schematic diagram shows interactions in the context of elementary connection motifs. The figure is from a recent paper summarizing evidence the mammalian neocortex is an elaboration of a brain area from a common ancestor of mammals, reptiles, and birds thought to have existed about 320 million years ago (“Neocortical Lamination: Insights from Neuron Types and Evolutionary Precursors” published November 7, 2017 in Frontiers in Neuroanatomy).

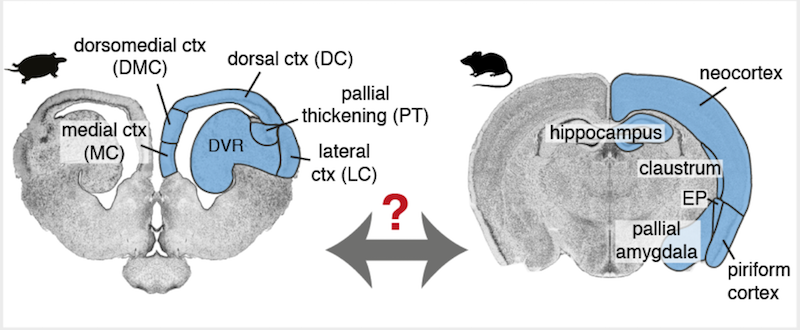
    Research on the evolutionary origin of or our six-layered neocortex may provide us glimpses into why specific neuron types or connection motifs provided selective advantages to our ancestors. Evidence from comparative anatomy and physiology suggests that the common ancestor had a three-layered brain region which was lost in birds, remained three-layered in reptiles, and developed into six-layered neocortex in mammals. Layered brain areas in today’s reptiles (turtles) and mammals (mice) that are thought to have a common origin are highlighted in blue in Figure 3 below.

    Figure 2. A schematic diagram of currently established elementary circuit configurations. The red triangle represents the cell body of a pyramidal cell. The thick trunk reaching up and ending with two thinner branches reaching diagonally is the pyramidal cell’s apical dendrite. The branches reaching diagonally down from the triangle’s two lower corners represent its basal dendrites. An axon leaves the bottom center of the pyramidal cell to various destinations (see text). Two other axons (red) enter the diagram. The axon that enters from right comes from other cortical areas. The axon that enters at left from below carries sensory input from the visual thalamus. Two inhibitory interneurons (blue) complete the circuit. ffexc: feed forward excitation, fbexc: feed back excitation, lexc: lateral excitation, ffinh: feed forward inhibition, fbinh: feedback inhibition. Figure 2(A) from “Neocortical Lamination: Insights from Neuron Types and Evolutionary Precursors” published November 7, 2017 in Frontiers in Neuroanatomy.

    Figure 3. The blue highlighted brain regions are thought to have common origins between reptiles (turtle at left) and mammals (mouse at right). Figure S1(A) from “Evolution of pallium, hippocampus, and cortical cell types revealed by single-cell transcriptomics in reptiles” published May 25, 2018 in Science.

    Single-cell RNA sequencing was used to investigate the evolution of brain regions thought to have common origins (blue in Figure 3) in a study published in Science(“Evolution of pallium, hippocampus, and cortical cell types revealed by single-cell transcriptomics in reptiles” published May 25, 2018). Genetic techniques provide some of the most direct methods available to investigate ancestral relationships among brain tissues. First, scientists pulled sequences of expressed genes from identified neuron types residing in specific regions of turtle and lizard brains. Next they looked in mammalian brains to see where those same gene sequences were expressed and in which neuron types.

    Figure 4. A schematic diagram of the six layered mammalian neocortex. The lamination of the basic circuit with elaboration of the excitatory pyramidal neuron into specialized intratelencephalic (IT), pyramidal tract (PT), and corticothalamic (CT) neurons. ffexc: feed forward excitation, fbexc: feed back excitation, lexc: lateral excitation, ffinh: feed forward inhibition, fbinh: feedback inhibition. Figure 2(C) from “Neocortical Lamination: Insights from Neuron Types and Evolutionary Precursors” published November 7, 2017 in Frontiers in Neuroanatomy.

    Researchers found inhibitory neurons express similar sets of genes in reptiles and mammals, indicating a common ancestry. In contrast, excitatory neurons differ substantially in gene expression across these two groups. Their results are consistent with Shepherd and Rowe’s idea that three-layer cortex was co-opted and transformed into six-layer cortex through the emergence of new types of excitatory neurons after the ancestral excitatory neurons went through profound changes of gene expression. The basic circuit module seen in the ancestral three-layer cortex in Figure 2 is transformed in the mammalian neocortex into layered versions of the basic circuit with three distinct genetically expressed versions of excitatory pyramidal cells as shown in Figure 4.

    In summary, recent research has provided a putative common ancestral circuit, the basic cortical module, and three variants in mammalian neocortex. Studies that compare and contrast signal processing in these four circuits could provide insights into how brains make sense and perceptions from the signals that flow through them.

  • ChemNetDB: Fifty Years of Rat Brain Connection and Neurotransmitter Data

    Nineteen large scale brain regions (listed) partition a 125 node cerebral connectome in a. Connectomes in b through f each match the color of a neurotransmitter listed at lower right. Figure 1 from “A multi scale cerebral neurochemical connector of the rat brain” published July 3, 2017 in PLOS Biology.

    Since the 1960s a lot of scientists have worked very hard, and a lot of rats have given their all, to trace brain connections and their neurotransmitters. Fundamental to understanding how the brain works is to know how it is wired and how the signals are transmitted by those wires. Work reported in a new paper “A multi scale cerebral neurochemical connector of the rat brain” (published July 3, 2017 in PLOS Biology) identified 1,560 original research articles with high quality connectivity data from 36,464 rats from the past 50 years that they transformed into multi scale atlas of rat brain connections and their neurotransmitters.

    The authors point to three main features ChemNetDB has over other existing databases. First, they claim that ChemNetDB is the most comprehensive rat connectivity database of the last 50 years of research data currently in existence. Second, they used a transparent, consistent, and validated method to integrate neurochemical information with the connectivity data. And third, they used data from animals of a consistent age along with transparent and consistent terminology.

    I was very excited on coming across and reading their paper. However, on visiting the site chemnetdb.org I was immediately struck by very limited data access. Perhaps there is a data endpoint or an Application Programming Interface (API). To my knowledge, the best you can currently do on the site is to search a brain area or structure and get a list of the areas connecting with that area or structure along with the connection’s neurotransmitters. Or the reverse: you may search on a neurotransmitter. References associated with the connections are displayed.

    The authors may have future plans but no hints have been provided. These data would be valuable as part of the rich set of life sciences linked-data available across the Internet. Their rat connectivity data could be associated with with a rat brain anatomy ontology and a huge and growing number of other relevant ontologies and opened up through SPARQL endpoints. Then there would be a world of possibilities!

  • Using R to Query Biomedical Data Distributed Across the Semantic Web

    Figure 1. The Gene Expression Atlas RDF Schema. Image courtesy of EMBL-EBI.

    A key idea behind the Semantic Web of linked-data is to enable seamless use of data from diverse sources across the Internet. Biological pathways data come from a huge number of laboratories from around the world and are captured and saved in a lot of different ways. We can use SPARQL endpoints to bring data together from any number of data repositories.

    In this post we’ll use the R package SPARQL to pull biological pathway data from WikiPathways while at the same time pulling the genes expressed in these pathways from the Gene Expression Atlas.

    You may find these related posts helpful: “WikiPathways: Open Biological Pathways Data on the Semantic Web” from June 27, 2017 and “Update on R and Semantic Web Technologies” from June 30, 2017.

    The Gene Expression Atlas provides data on what genes or proteins are expressed in a particular species under specific conditions. It also provides data on differential expression, the increase or decrease of gene expression or protein production under specific conditions.

    Let’s look for human biological pathways that show different gene activity under Alzheimer’s disease than under normal circumstances. Differences are indicated by significant increases or decreases in gene expression.

    First, look up the identifier for Alzheimer’s disease using
    the EMBL-EBI Ontology Lookup Service.

    Figure 2. EMBL-EBI Ontology Lookup Service

    Type Alzheimer’s disease into the Search EFO search box in the upper right area of the EMBL-EBI Ontology Lookup Service page (see Figure 2 above).

    EFO stands for Experimental Factor Ontology.

    A large list of factors appear that are associated with Alzheimer’s disease but the one we’re interested in, listed as Alzheimer’s disease, should be on the first page and provide the identifier EFO:0000249.

    The following discussion assumes that you’ve installed and loaded the R package SPARQL. If not, please see the June 30, 2017 post “Update on R and Semantic Web Technologies.”

    Assign the WikiPathways SPARQL endpoint URL to the endpoint variable in your R environment.

    endpoint <- 'http://sparql.wikipathways.org'

    Next, assign a SPARQL query to the query variable like in the following code snippet.

    query <- 'PREFIX identifiers:<http://identifiers.org/ensembl/>
    PREFIX atlas: <http://rdf.ebi.ac.uk/resource/atlas/>
    PREFIX atlasterms: <http://rdf.ebi.ac.uk/terms/atlas/>
    PREFIX efo: <http://www.ebi.ac.uk/efo/>

    SELECT DISTINCT ?wpURL ?pwTitle ?expressionValue ?pvalue where {
    SERVICE <https://www.ebi.ac.uk/rdf/services/atlas/sparql> {
    ?factor rdf:type efo:EFO_0000249 .
    ?value atlasterms:hasFactorValue ?factor .
    ?value atlasterms:isMeasurementOf ?probe .
    ?value atlasterms:pValue ?pvalue .
    ?value rdfs:label ?expressionValue .
    ?probe atlasterms:dbXref ?dbXref .
    }
    ?pwElement dcterms:isPartOf ?pathway .
    ?pathway dc:title ?pwTitle .
    ?pathway dc:identifier ?wpURL .
    ?pwElement wp:bdbEnsembl ?dbXref .
    }
    ORDER BY ASC(?pvalue)'

    The full statement above is sent to the WikiPathways SPARQL endpoint (the URL assigned to the endpoint variable). However, the search terms in the embedded SERVICE statement are forwarded to the Gene Expression Atlas SPAQL endpoint (the URL following SERVICE).

    The first triple inside the SERVICE statement sets the ?factor variable to the Alzheimer’s disease identifier you found above. Notice that the colon was swapped out for an underscore so that EFO:0000249 became EFO_0000249.

    The second through fifth triples will all have the same subject, which is assigned to the ?value variable. The first three use predicates from the atlasterms namespace. Look at the lower right quadrant of the Gene Expression Atlas RDF Schema (see Figure 1 above). Each of the three Gene Expression Atlas specific predicates (hasFactorValue, isMeasurementOf, and pValue) has atlas:DifferentialExpressionRatio as their subject.

    The final triple also uses a predicate from the atlasterms namespace. dbXref is a predicate of atlas:ProbeDesignElement that is itself the object pointed to by isMeasurementOf from atlas:DifferentialExpressionRatio. The dbXref predicate provides a bridge across various databases.

    Finally, enter the SPARQL function to carry out our query and assign our results to the data variable.

    data <- SPARQL(endpoint, query)

    Run the R summary function on the data assigned to the data variable to see how data were returned by SPARQL.

    summary(data)

    SPARQL returned an R data frame and assigned it to data$results.

    Take a peek at the first six rows of the results by running the R head function on the data frame assigned to data$results.

    head(data$results)

    Figure 3. Using R and the R package SPARQL to federate data from WikiPathays and the Gene Expression Atlas

    Refer to Figure 3 above to see all interactions with the R console for this exercise. As you go through analysis, you’ll find that all but 2 of the 84 pathways show decreased gene expression in Alzheimer’s disease. Two pathways show increased COL27A1 gene expression.

    Mining the world’s linked-data is relatively easy using R and the R package SPARQL. You must be proficient in SPARQL, be able to navigate ontologies, and know where the SPARQL endpoints are. You did all of this to pull pathway and differential gene expression data associated with Alzheimer’s disease and used them as a single integrated dataset!