Category Archives: Brain Science

Using R to Query Biomedical Data Distributed Across the Semantic Web

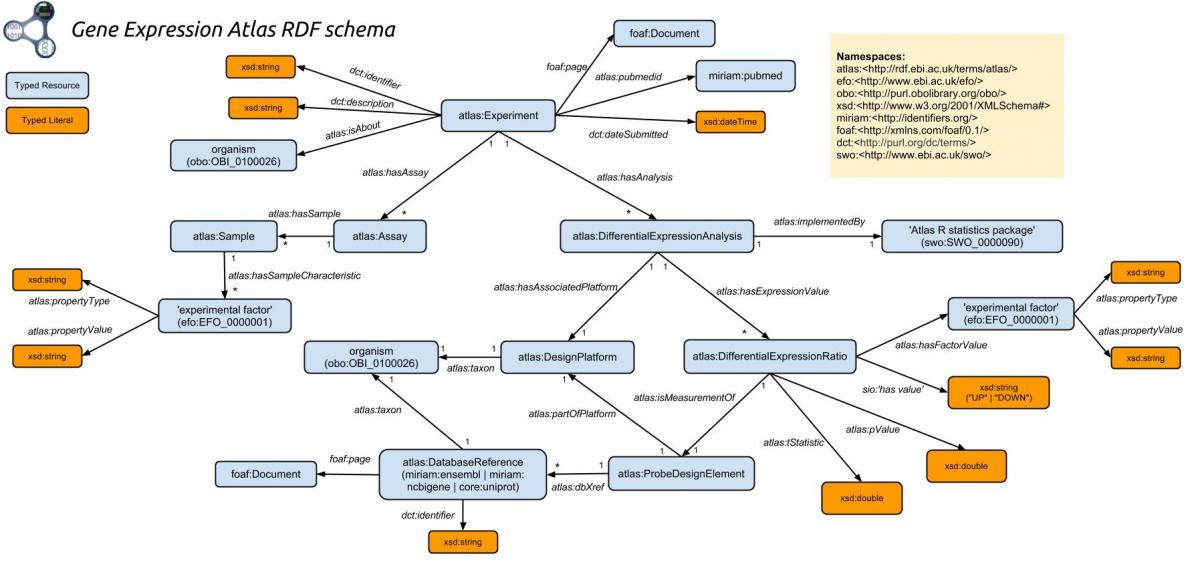
Figure 1. The Gene Expression Atlas RDF Schema. Image courtesy of EMBL-EBI.

A key idea behind the Semantic Web of linked-data is to enable seamless use of data from diverse sources across the Internet. Biological pathways data come from a huge number of laboratories from around the world and are captured and saved in a lot of different ways. We can use SPARQL endpoints to bring data together from any number of data repositories.

In this post we’ll use the R package SPARQL to pull biological pathway data from WikiPathways while at the same time pulling the genes expressed in these pathways from the Gene Expression Atlas.

You may find these related posts helpful: “WikiPathways: Open Biological Pathways Data on the Semantic Web” from June 27, 2017 and “Update on R and Semantic Web Technologies” from June 30, 2017.

The Gene Expression Atlas provides data on what genes or proteins are expressed in a particular species under specific conditions. It also provides data on differential expression, the increase or decrease of gene expression or protein production under specific conditions.

Let’s look for human biological pathways that show different gene activity under Alzheimer’s disease than under normal circumstances. Differences are indicated by significant increases or decreases in gene expression.

First, look up the identifier for Alzheimer’s disease using
the EMBL-EBI Ontology Lookup Service.

Figure 2. EMBL-EBI Ontology Lookup Service

Type Alzheimer’s disease into the Search EFO search box in the upper right area of the EMBL-EBI Ontology Lookup Service page (see Figure 2 above).

EFO stands for Experimental Factor Ontology.

A large list of factors appear that are associated with Alzheimer’s disease but the one we’re interested in, listed as Alzheimer’s disease, should be on the first page and provide the identifier EFO:0000249.

The following discussion assumes that you’ve installed and loaded the R package SPARQL. If not, please see the June 30, 2017 post “Update on R and Semantic Web Technologies.”

Assign the WikiPathways SPARQL endpoint URL to the endpoint variable in your R environment.

endpoint <- 'http://sparql.wikipathways.org'

Next, assign a SPARQL query to the query variable like in the following code snippet.

query <- 'PREFIX identifiers:<http://identifiers.org/ensembl/>
PREFIX atlas: <http://rdf.ebi.ac.uk/resource/atlas/>
PREFIX atlasterms: <http://rdf.ebi.ac.uk/terms/atlas/>
PREFIX efo: <http://www.ebi.ac.uk/efo/>

SELECT DISTINCT ?wpURL ?pwTitle ?expressionValue ?pvalue where {
SERVICE <https://www.ebi.ac.uk/rdf/services/atlas/sparql> {
?factor rdf:type efo:EFO_0000249 .
?value atlasterms:hasFactorValue ?factor .
?value atlasterms:isMeasurementOf ?probe .
?value atlasterms:pValue ?pvalue .
?value rdfs:label ?expressionValue .
?probe atlasterms:dbXref ?dbXref .
}
?pwElement dcterms:isPartOf ?pathway .
?pathway dc:title ?pwTitle .
?pathway dc:identifier ?wpURL .
?pwElement wp:bdbEnsembl ?dbXref .
}
ORDER BY ASC(?pvalue)'

The full statement above is sent to the WikiPathways SPARQL endpoint (the URL assigned to the endpoint variable). However, the search terms in the embedded SERVICE statement are forwarded to the Gene Expression Atlas SPAQL endpoint (the URL following SERVICE).

The first triple inside the SERVICE statement sets the ?factor variable to the Alzheimer’s disease identifier you found above. Notice that the colon was swapped out for an underscore so that EFO:0000249 became EFO_0000249.

The second through fifth triples will all have the same subject, which is assigned to the ?value variable. The first three use predicates from the atlasterms namespace. Look at the lower right quadrant of the Gene Expression Atlas RDF Schema (see Figure 1 above). Each of the three Gene Expression Atlas specific predicates (hasFactorValue, isMeasurementOf, and pValue) has atlas:DifferentialExpressionRatio as their subject.

The final triple also uses a predicate from the atlasterms namespace. dbXref is a predicate of atlas:ProbeDesignElement that is itself the object pointed to by isMeasurementOf from atlas:DifferentialExpressionRatio. The dbXref predicate provides a bridge across various databases.

Finally, enter the SPARQL function to carry out our query and assign our results to the data variable.

data <- SPARQL(endpoint, query)

Run the R summary function on the data assigned to the data variable to see how data were returned by SPARQL.

summary(data)

SPARQL returned an R data frame and assigned it to data$results.

Take a peek at the first six rows of the results by running the R head function on the data frame assigned to data$results.

head(data$results)

Figure 3. Using R and the R package SPARQL to federate data from WikiPathays and the Gene Expression Atlas

Refer to Figure 3 above to see all interactions with the R console for this exercise. As you go through analysis, you’ll find that all but 2 of the 84 pathways show decreased gene expression in Alzheimer’s disease. Two pathways show increased COL27A1 gene expression.

Mining the world’s linked-data is relatively easy using R and the R package SPARQL. You must be proficient in SPARQL, be able to navigate ontologies, and know where the SPARQL endpoints are. You did all of this to pull pathway and differential gene expression data associated with Alzheimer’s disease and used them as a single integrated dataset!

The Science Behind AlphaGo: Games of Perfect Information

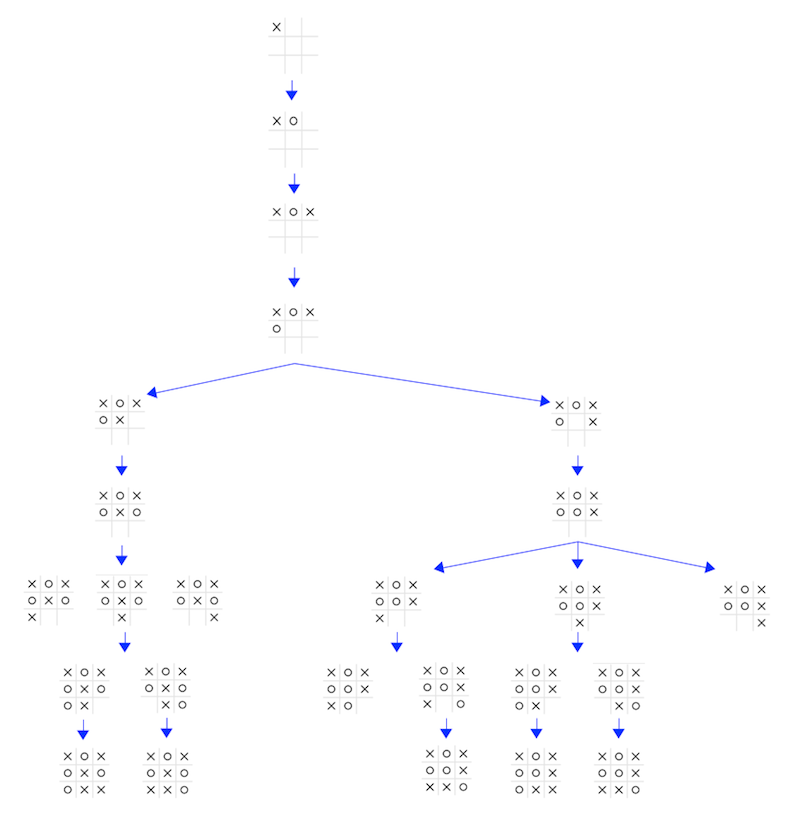
Full Depth of One Branch in Tic-Tac-Toe

Figure 1. A diagram of possible tic-tac-toe game states (nodes) from first moves to last possible moves. Diagram breadth has been severely limited so that we may follow a couple pipelines (sequences of moves) to their end states (leaf nodes).

A great place to begin contemplating the science behind a computer program’s mastery of Go is at the beginning of the recent paper “Mastering the game of Go with deep neural networks and tree search” (published January 28, 2016 in Nature).

The first sentence begins “All games of perfect information…”

When a player is about to make a move in games of perfect information, the player can know all of the previous events that occurred since the start of the game. The AlphaGo paper cited above moves quickly from this brief reference to more complex ideas. It is worth our effort to contemplate the the idea of games of perfect information more thoroughly.

A paper published five years ago “Monte-Carlo tree search and rapid action value estimation in computer Go” (published July 2011 in Artificial Intelligence) explores the idea more thoroughly while considering two-player, perfect-information, zero-sum games like tic-tac-toe and checkers.

Let’s contemplate tic-tac-toe. What could be easier?

The first of two players sets an ‘X’ (cross) in one square in a three-by-three grid. The first player has 9 possible squares to select from (see Figure 2 below).

Tic-Tac-Toe First Move

Figure 2. There are 9 and only 9 possible first moves in tic-tac-toe.

The second player then makes her first move by setting an ‘O’ (nought) in 1 of the 8 remaining squares in the three-by-three grid (see Figure 3 below).

Tic-Tac-Toe Second Move

Figure 3. There are 8 and only 8 possible first moves for the second player in tic-tac-toe. However, there are 9 different configurations of 8 possible moves depending on where the first player places an ‘X’ (cross). This diagram shows only when the first player placed a cross in the top-left-most square. Eight more tree branches may be displayed to show all possible second player moves depending on which of 9 moves the first player chose as their first move.

Each player continues to play alternate moves until there are 3 crosses in a row (first player wins) or 3 noughts in a row (second player wins) or all 9 squares are filled (game is a draw; no one wins).

It is possible to draw a diagram containing every possible move and every possible sequences of moves that may be played in a game by creating an upside-down tree (inverted tree) that starts with the 9 possible moves shown in Figure 2. Each of the 9 possible moves, each representing a node in our inverted tree diagram, would be connected to the 8 possible moves (8 nodes) by the second player so that by the end of our two players’ first move our diagram would show 9 x 8 = 72 nodes. Think of a Figure 3 diagram created for each possible move in Figure 2 and all displayed in a single diagram.

These 72 nodes represent every possible move that players one and two may make during each player’s first turn. The potential moves and pipelines (sequence of moves) are completely determined. We cannot know the moves and sequence of moves that players will decide on during a particular game before that game is played. However, we do know every possible move and sequence of moves that they can make at each step of the game.

The entire tic-tac-toe world of possibilities can be laid out before us and, depending on the history of moves taken up to the moment we’re considering, we can know exactly what we may do next. We have perfect information about our tic-tac-toe world and what we may do in it.

Going Deep

So far we’ve considered the number of possible locations each player may play their move during their turn (breadth of possibilities) and just the first move of players one and two deep (depth; the sequence of moves across alternate turns). However, the depth of our inverted tree continues until a player wins with 3 in a row or all of the 9 squares are filled. Figure 1 above shows a diagram with restricted breadth but full depth.

At top of Figure 1 is our first player’s first move. Recall that this is just 1 of 9 possible moves (1 from a total breadth of 9).

Next down is our second player’s first move. Again, recall that this is just 1 of 8 possible moves. Also, before our first player selected a move, there were 8 more branches of 8 potential first moves for our second player.

The third level down in Figure 1 shows our first player’s second move based on our second player placing a nought in top row center. This is 1 of 7 possible moves.

In the fourth level down, our second player responds with her second move. One of 6 possible moves.

A pattern is apparent with 9 x 8 x 7 x 6 … potential moves. If we continue to ignore symmetries and other aspects of the tic-tac-toe game space that you probably notice, the full tic-tac-toe potential play space is indeed 9 x 8 x 7 x 6 x 5 x 4 x 3 x 2 x 1 or 9! (9 factorial) in size or 362,880.

Notice in the fifth level down, our first player’s third turn, I widen the breadth a bit and show 2 of the player’s 5 possible moves so we can see some of the variability in the end game (leaf node) pattern.

On our players’ fourth move (seventh and eighth levels down from top in Figure 1) we begin to see leaf nodes where the game ends. Two of the 3 possible first player moves displayed in level seven of the left-most branch are end leaf nodes with three crosses in a row (our first player would win).

This glimpse at a piece of the complete tic-tac-toe inverted-tree game space shows us how all of the information about winning, losing, and draw exists before a game of perfect information is even begun. Players choose from a limited set of options that determine the options that follow.

Today’s computers can easily maintain the complete game space information for tic-tac-toe. However, as the game becomes more complex, the game space increases extremely quickly. Checkers has a space of about 500 billion billion, chess has about 1040 and Go, another game of perfect information, has a space larger than all of the atoms in our known universe!

Clearly it’s possible to play games like Go since humans have done it for a very long time. How does a human brain do it? How can we get computers to do it? We’ll continue to explore these problems right here on my ActionPotential blog.

The Science Behind a Computer Program’s Mastery of Go

AlphaGo Paper Figure 1

Figure 1. The high-level diagram of AlphaGo’s deep neural network pipeline and architecture from Figure 1 in the paper “Mastering the game of Go with deep neural networks and tree search” published January 28, 2016 in Nature.

This past March a high profile challenge match for one million dollars took place between the computer program AlphaGo and the world’s top human Go player Lee Sedol. AlphaGo won 4 out of 5 matches and won the challenge.

Five months before, on October 2015, AlphaGo became the first computer program in history to beat a professional Go player when it won 5 out of 5 matches against European Champion Fan Hui. The following January, the paper “Mastering the game of Go with deep neural networks and tree search” (published January 28, 2016 in Nature) was published that discussed the mechanisms used to power of AlphaGo in that match. They may be summarized as powered by deep neural networks trained using a combination of 1) supervised learning from human expert games and 2) reinforcement learning from games of self play (see Figure 1 above).

An enormous amount of research is encapsulated in the overview shown in figure 1. Stay tuned and we will examine the science behind the computer algorithms that enabled AlphaGo to play go at an impressive level of mastery.