Listing possible brain states at neuron level would be as impossible as listing every real number between zero and one. Typically neuroscientists place neuron activity – spikes – into discrete time bins (Figure 1b). Binning transforms continuous time into discrete arrays of zeros (bins with no spikes) and ones (bins with spikes; Figure 1b). A finite number in contrast with the infinite real numbers to be found between zero and one. Nevertheless, the set of 40 neurons in Figure 1a has 240 possible states. Over a trillion states 1,099,511,627,776! Now imagine trying to capture each state of tens of thousands of neurons (about a 0.3 cubic millimeters of cortex) or of the billions of neurons composing your whole brain.
To understand mammalian brain function we must not only understand how individual neurons work but also the results of interactions among large numbers of neurons. Statistical and condensed matter physics have shown us that new features emerge from interactions among large numbers of relatively simple units. For example, we think about matter as solids, liquids, and gases … those are the collective features of innumerable interacting atoms … and we observe transitions between these physical states. Indeed, one may predict new properties based on the combination of atomic properties and our understanding of how large collections of atoms interact under specific conditions. Inspired by these results, some neuroscientists have explored methods to quantize neuronal ensemble activity.

A research team lead by William Bialek observed weakly correlated spiking between pairs of salamander retinal ganglion cells, which suggested independent spiking among the neurons (“Weak pairwise correlations imply strongly correlated network states in a neural population“, 2006). As the team increased the number of neurons they looked at, the observations and expectations based on the assumption of independence matched with up to 4 neurons with a probability of about 10-1.3 or 0.05 that all 4 neurons would spike during a 20 millisecond window. After 4 neurons, the probability that all the independent neurons would spike during the same window of time dropped precipitously (Figure 2; dark blue). Observed correlated activity (Figure 2; red) exceeded the independent neurons prediction by many orders of magnitude. The weak pairwise correlations somehow lead to strongly correlated states in the larger neuronal ensemble.

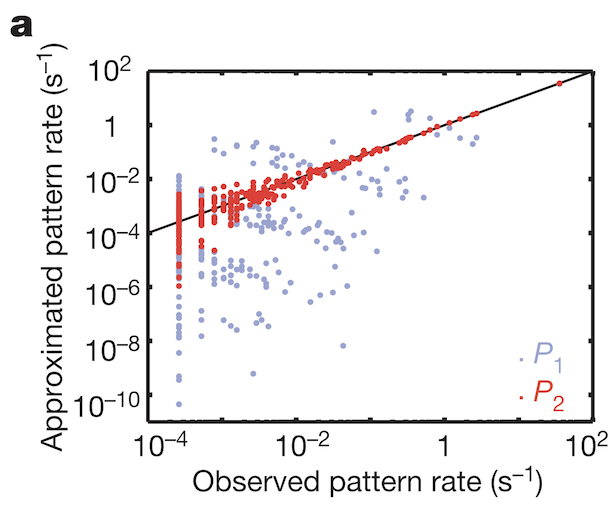
To understand how weak pairwise correlations could imply strongly correlated states, the research team applied the principle of maximum entropy. Would the assumption hold that the probability distribution of synchronous patterns (represented by the 10 bit binary words at bottom of Figure 1b) match probability distribution patterns at the system’s largest entropy values? Indeed, measured frequencies of synchronous pattern appearance (Figure 3, red dots) matched very well with patterns around maximum entropy (Figure 3, black line). These results from maximum entropy may be mapped directly to the Ising model. A felicitous model of interactions in neuronal ensembles appears to be equivalent to models used when studying phase transitions in matter.