Category: Brain Science

  • Innumerable Brain States and the Search for a Neuronal Ensemble Theory

    Figure 1. Responses of retinal ganglion cells in the salamander retina to a natural movie clip. (a) Responses of 40 retinal ganglion cells over 12 seconds (time along x-axis). Each number on the y-axis represents a neuron and each horizontal set of dots represents spikes associated with a neuron. (b) Spike trains are placed into discrete 20 millisecond time bins (top). Data are from the green boxed area in a. This subset containing 10 neurons has 210 possible states (1,025) which is much more manageable than has 240. At bottom, each time bin from above is represented by a 10 bit word (one bit for each neuron). Each binary word represents a 10 neuron network state. From figure 1 in ” Weak pairwise correlations imply strongly correlated network states in a neural population” (2006).

    Listing possible brain states at neuron level would be as impossible as listing every real number between zero and one. Typically neuroscientists place neuron activity – spikes – into discrete time bins (Figure 1b). Binning transforms continuous time into discrete arrays of zeros (bins with no spikes) and ones (bins with spikes; Figure 1b). A finite number in contrast with the infinite real numbers to be found between zero and one. Nevertheless, the set of 40 neurons in Figure 1a has 240 possible states. Over a trillion states 1,099,511,627,776! Now imagine trying to capture each state of tens of thousands of neurons (about a 0.3 cubic millimeters of cortex) or of the billions of neurons composing your whole brain.

    To understand mammalian brain function we must not only understand how individual neurons work but also the results of interactions among large numbers of neurons. Statistical and condensed matter physics have shown us that new features emerge from interactions among large numbers of relatively simple units. For example, we think about matter as solids, liquids, and gases … those are the collective features of innumerable interacting atoms … and we observe transitions between these physical states. Indeed, one may predict new properties based on the combination of atomic properties and our understanding of how large collections of atoms interact under specific conditions. Inspired by these results, some neuroscientists have explored methods to quantize neuronal ensemble activity.

    Figure 2. Probability distribution of synchronous spiking events in a population of 40 salamander retinal ganglion cells. Synchronous responses from 40 neurons in response to a natural movie (red) approximates an exponential (dashed red). The distribution of synchronous spikes for the same 40 neurons after shuffling each neuron’s spike train to eliminate all correlations (blue) compared with a Poisson distribution (dashed light blue). From figure 1 in ” Weak pairwise correlations imply strongly correlated network states in a neural population” (2006).

    A research team lead by William Bialek observed weakly correlated spiking between pairs of salamander retinal ganglion cells, which suggested independent spiking among the neurons (“Weak pairwise correlations imply strongly correlated network states in a neural population“, 2006). As the team increased the number of neurons they looked at, the observations and expectations based on the assumption of independence matched with up to 4 neurons with a probability of about 10-1.3 or 0.05 that all 4 neurons would spike during a 20 millisecond window. After 4 neurons, the probability that all the independent neurons would spike during the same window of time dropped precipitously (Figure 2; dark blue). Observed correlated activity (Figure 2; red) exceeded the independent neurons prediction by many orders of magnitude. The weak pairwise correlations somehow lead to strongly correlated states in the larger neuronal ensemble.

    Figure 3. A maximum entropy model including all pairwise interactions gives an excellent approximation of the full network correlation structure. Using the same group of 10 cells from Figure 1b, the rate of occurrence of each firing pattern is predicted from the maximum entropy model (y-axis) and plotted (P2; red dots) against the measured rate (x-axis). The gray dots show the rate of occurrence of the same firing patterns but with the independent model. From figure 2 in ” Weak pairwise correlations imply strongly correlated network states in a neural population” (2006).

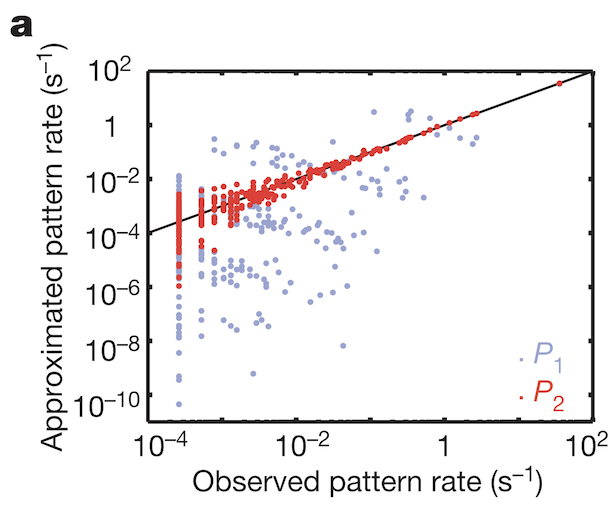
    To understand how weak pairwise correlations could imply strongly correlated states, the research team applied the principle of maximum entropy. Would the assumption hold that the probability distribution of synchronous patterns (represented by the 10 bit binary words at bottom of Figure 1b) match probability distribution patterns at the system’s largest entropy values? Indeed, measured frequencies of synchronous pattern appearance (Figure 3, red dots) matched very well with patterns around maximum entropy (Figure 3, black line). These results from maximum entropy may be mapped directly to the Ising model. A felicitous model of interactions in neuronal ensembles appears to be equivalent to models used when studying phase transitions in matter.

  • Cortical Microcircuit States: Follow-up to Yesterday’s Post

    Figure 1. Cortical microcircuit states and extracellular calcium concentration. (A) Spontaneous synchronous bursts associated with deep sleep and (B) spontaneous asynchronous activity associated with wakefulness. (C and D) Voltage cross-correlations for a range of extracellular calcium concentrations. From figure S14 in “Reconstruction and Simulation of Neocortical Microcircuitry” (2015).

    Yesterday’s post discussing the recent paper “The Role of Hub Neurons in Modulating Cortical Dynamics“ (2021) ended with a number of questions.  In particular, questions about the cortical microcircuit’s activity states. Spontaneously synchronous bursts were observed when the extracellular calcium concentration was set to 1.4 mM. Spontaneous asynchronous activity was observed when the calcium concentration was 1.25 mM (this state wasn’t mentioned in yesterday’s post). A major question we were left with was, what are the equivalent behavioral states associated with these brain states?

    This question was addressed in detail by the same research team in their 2015 paper “Reconstruction and Simulation of Neocortical Microcircuitry“. The researchers incrementally varied extracellular calcium concentration in their simulated cortical microcircuit within a range based on data from intact organisms. At the lower concentration of 1.25 mM they saw spontaneous asynchronous activity, which is typically associated with wakefulness (Figure 1B). As they increased the extracellular calcium concentration, neuronal activity became more synchronous until they saw spontaneous synchronized bursts about once every second, which is typically associated with deep sleep (Figure 1A). Notice the steep transition between states in Figure 1C (spontaneous synchronized bursts has the higher cross-correlation value).

    In conclusion, there are solid data to associate the two cortical circuit states spontaneous synchronized bursts and spontaneous asynchronous activity to deep sleep and wakefulness respectively. The question of the existence of spectral analyses on these data remains. Please tweet me if you find any!

    See Also

    Highly Connected Neurons Influence Spontaneously Synchronized Bursts in Cortex (Yesterday’s Post)

  • Highly Connected Neurons Influence Spontaneously Synchronized Bursts in Cortex

    Figure 1. Effects of removing hub neurons on cortical activity patterns. (A) Spontaneous bursting activity in the intact cortical circuit. The x-axis is labeled time in seconds. The y-axis for the top raster plot is labeled with the cortical layer, with each horizontal set of rasters from an individual neuron. The y-axis in the bottom plot is labeled with the total number of spikes per second. (B) Same as A except 2,977 hub neurons were turned off. (D) Same as B except 2,977 randomly selected neurons were turned off. From figure 2 in “The Role of Hub Neurons in Modulating Cortical Dynamics” (2021).

    Brain cells with more than the average number of connections with other neurons are known as hub neurons. Hub neurons have been shown to significantly decrease the average path length of communication from any one neuron to another, which results in what is called a small world network. Recent research investigated hub neurons and their contributions to simulated cortical circuit activity (“The Role of Hub Neurons in Modulating Cortical Dynamics“, 2021).

    Synchronous bursts of activity at about 1 Hz (Figure 1A above) was spontaneously generated by a data-driven simulation of a 0.3 cubic millimeters piece of cortex. The cortical microcircuit contained 31,000 neurons, about 37 million synapses, and 55 morphological cell types. Interestingly, 1 Hz is the delta oscillation frequency, which is most prominent in cortex during deep sleep. Unfortunately, spectral analysis was not addressed in this paper.

    The number of network bursts was precipitously reduced and periodicity was far less sharply defined when the investigators turned off 2,977 hub neurons selected randomly among the hub neuron sub-population (Figure 1B above). In contrast, network bursting remained unaltered when they turned off 2,977 randomly selected neurons (Figure 1D above). Hub neurons clearly contributed to the 1 Hz spontaneously synchronous bursts of activity.

    Next the research team turned off hub neurons one cortical layer at a time (except for layer 1) and then observed network activity. Turning off random hub neurons across all layers had the most robust affect on all network activity measures: reduced bursts, reduced firing rates, reduced coefficient of variation, and decreased correlation. Removing layer 5 hub neurons had the largest effect of the layer specific manipulations. Interestingly, removing a relatively small number of layer 4 hub neurons reduced spontaneously synchronized burst activity well before effects were seen from hub neuron removal from any other layer or from across all layers.

    In summary, hub neurons in general and layer 5 hub neurons in particular contributed to the spontaneously synchronized bursts of activity in simulated cortical microcircuit experiments (“The Role of Hub Neurons in Modulating Cortical Dynamics“, 2021). These intriguing results suggest taking closer looks at the effects of specific layer 5 neuron types that have hub connectivity. It would also be informative to see a more detailed look at the cortical circuit’s neural dynamics. In particular, is the pre-manipulated simulated cortical circuit activity equivalent to awake activity in real brains? Deep sleep activity in real brains? Cortical slice activity? And what do the spectral analyses show?

    See Also

    Cortical Microcircuit States: Follow-up to Yesterday’s Post